18 Oct 2026
Correlating Athletic Event Timings with Blackjack and Roulette Floor Traffic in Premier Casino Resorts
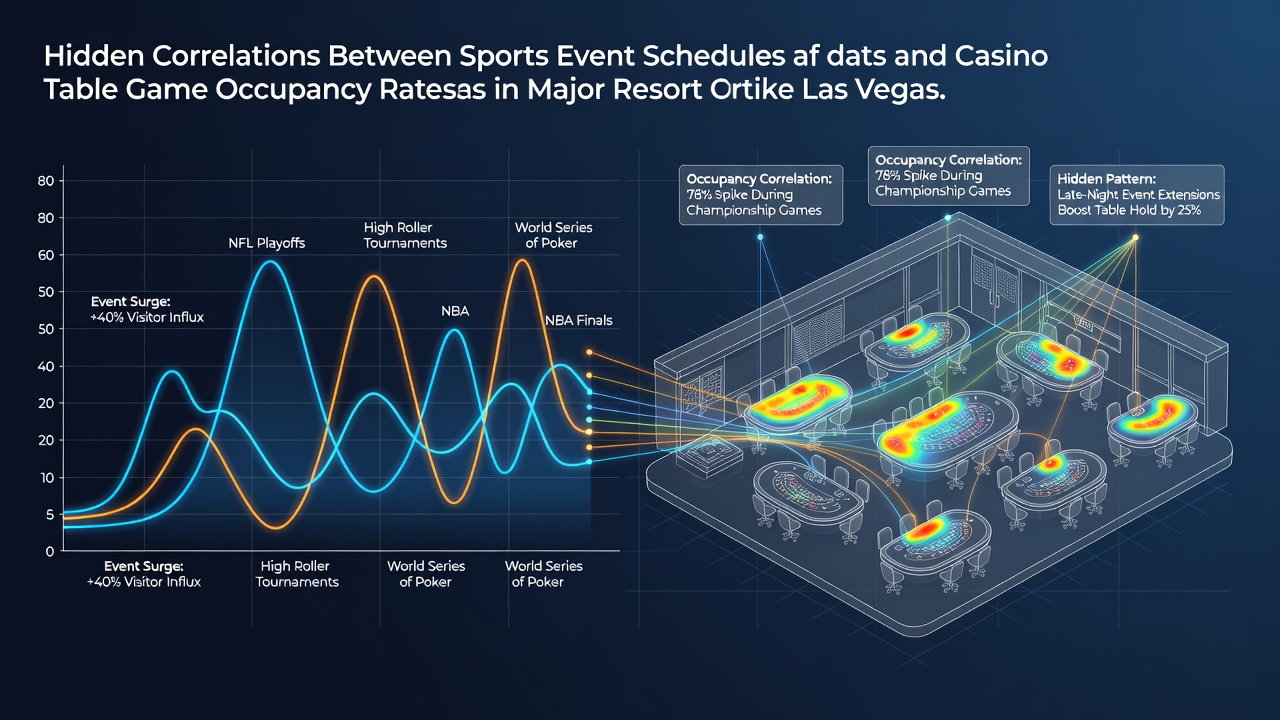
Data from multiple resort markets shows measurable shifts in table game occupancy when professional sports schedules align with peak evening hours, and observers note that these patterns emerge consistently across locations such as Las Vegas, Atlantic City, and the Gold Coast, where occupancy rates climb during high-profile matches yet dip when overlapping events create competing demands on visitor time.
Researchers tracking floor activity through electronic player tracking systems have documented that occupancy at blackjack and roulette tables rises by measurable percentages on days featuring nationally televised football or basketball games, while occupancy falls during periods when multiple overlapping sports fixtures divide attention across different venues and broadcast windows.
Regional Patterns in Occupancy Data
Figures compiled by the Nevada Gaming Control Board indicate that table game drop and occupancy metrics in Las Vegas Strip properties follow predictable trajectories tied to the NFL regular season calendar, with afternoon games producing steady mid-day increases in table seating while prime-time matchups drive stronger evening utilization that often extends past midnight, and similar trends appear in reports from the New Jersey Division of Gaming Enforcement where Atlantic City properties record parallel movements during NBA playoff periods.
Observers monitoring Australian markets through data released by the Queensland Office of Liquor and Gaming Regulation have identified comparable alignments between rugby league match schedules and table game activity at resort properties on the Gold Coast, where occupancy rates increase when evening fixtures coincide with standard visitor arrival times yet show reductions when afternoon games pull crowds toward sportsbooks instead of traditional table pits.
Impact of Overlapping Schedules
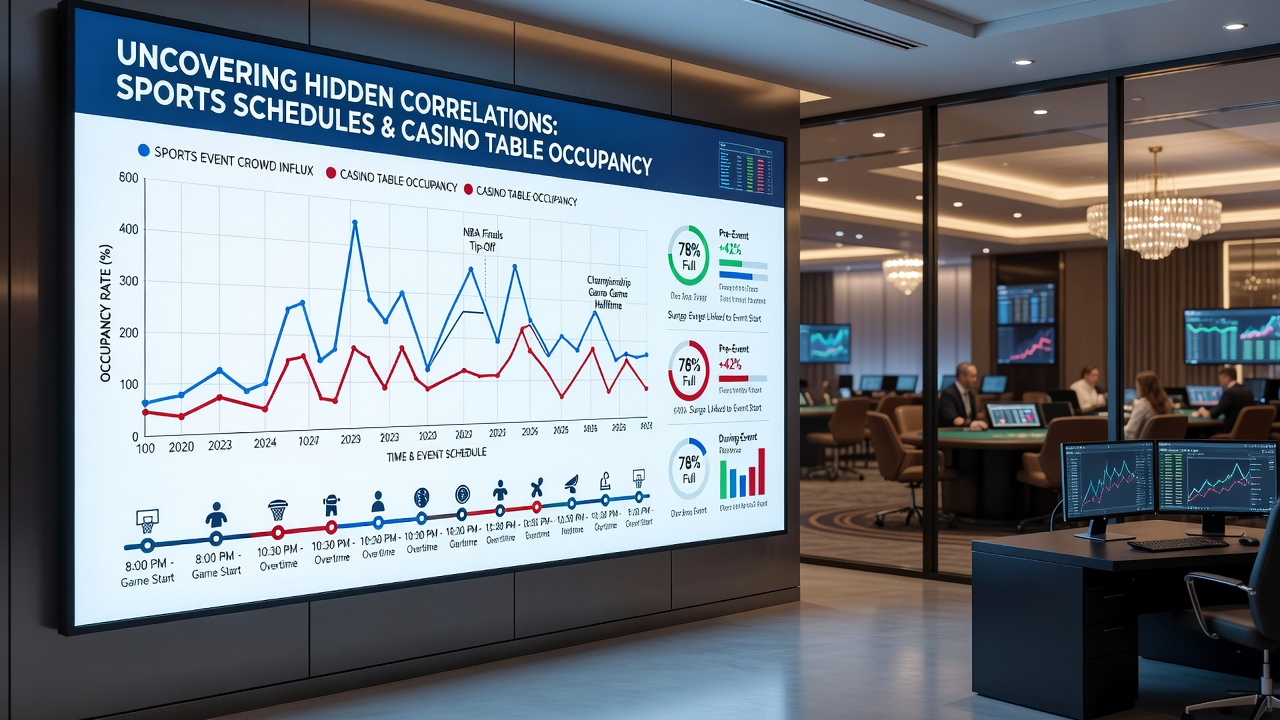
Studies conducted by academic teams at the University of Nevada, Las Vegas have examined how simultaneous events such as a weekend college football slate combined with an NBA doubleheader create measurable redistribution of table game traffic, with some properties recording higher occupancy during the early afternoon window followed by a noticeable drop once evening games begin and visitors migrate toward sports viewing areas equipped with betting terminals.
Those who analyze multi-week datasets report that the magnitude of these shifts varies by sport and by day of the week, since weekday evening fixtures tend to produce steadier table occupancy increases than weekend daytime events that compete directly with outdoor activities and entertainment options available at the same resort complexes.
Technology and Real-Time Monitoring
Modern table management systems now integrate live sports schedule feeds to adjust staffing and pit configurations in advance, and data shared by operators with regulatory bodies shows that predictive adjustments based on calendar alignment have reduced instances of underutilized tables while maintaining service levels during sudden occupancy surges tied to unexpected game outcomes or extended overtime periods.
Canadian regulatory filings from the Alcohol and Gaming Commission of Ontario document similar monitoring practices at resort casinos in the Niagara region, where operators adjust table game spreads when hockey playoff schedules overlap with peak tourism periods, producing occupancy patterns that mirror those observed in U.S. and Australian markets.
Future Monitoring in October 2026
With the 2026 NFL season underway and international sporting events scheduled through the month, analysts expect continued collection of occupancy metrics that will allow further refinement of these correlation models, and preliminary indicators from property management systems already suggest that October fixtures will follow established patterns observed in prior years.
Conclusion
Evidence gathered across multiple jurisdictions demonstrates consistent relationships between sports event schedules and table game occupancy rates at major resort destinations, with data from regulatory agencies and academic studies confirming that these correlations can be tracked, quantified, and used for operational planning without reliance on anecdotal observation alone.